

There are two kinds of Day Trading:
The first is called Scalping, which entails entering very short term trades with a large amount of shares, hoping for a relatively small movement in the price. Most Scalping trades usually last no more than five or ten minutes, and can give you a few hundred dollars or more in net profits. These kinds of trades are usually done primarily using the one-minute chart, with help from the five-minute chart.
The other style of Day Trading can last much longer. This kind of Day Trade can last as long as an hour, or even a few hours if it goes very well. I will teach you when it's time to stay in a trade to maximize profits if the trade is going well. These kind of trades primarily use the five-minute chart, but I also use the fifteen-minute and the hourly charts too.
Day Trading is a very exciting and fast paced way to trade the Stock Market. It is also the fastest way to learn all about Charts and Technical Indicators in the shortest amount of time. Due to the extreme volatility we've seen in the market in 2008 - 2009, Day Trading is the safest and most profitable way to trade these days.
Day Trading requires a solid understanding of reading Candlestick Charts and just a few of the Technical Indicators that are included with them. The Technical Indicators will give you very clear Buy and Sell Signals many times a trading session. You must also know how to read Time & Sales and Level 2 windows. That is exactly what you will learn when you take these lessons.
Here is an example of a one and a half day chart of Akamai Technologies (AKAM),
which was my favorite stock to Day Trade in 2005-2006.

As you can see, it moves a dollar or more very quickly, and I'll teach you how to play these swings up and down so that you can profit either way it moves. On the chart below, you are not only limited to buying at the bottom and selling at the top. Once you sell at the top, you can immediately take a Short position and ride it to the bottom. Then you will Cover your Short position and immediately take a Long position and ride it back up to the top.

There are just a few Technical Indicators necessary for my Day Trading strategy to work. The Commodity Channel Index (CCI) gives very clear and accurate Buy and Sell Signals, and I use Stochastics (STO) to confirm them. Bollinger Bands are also very important in my strategy, and Volume is too. The last two Indicators I use are the 5 Simple Moving Average (5-SMA) and the 15 Simple Moving Average (15-SMA) which also give good Buy or Sell Signals.
The chart of TSO below shows how I setup my charts for Day Trading. I also use three extra Technical Indicators known as the Money Indicators. They basically show if there are more Buyers or Sellers. The dark green one at the top is Chaikin Money Flow (CMF), the yellow line is On Balance Volume (OBV), and the light blue one is the Accumulation/Distribution (A/D) line.
In order for my strategy to work, you don't really need to learn these three additional Technical Indicators. It works fine without them, but if you want to learn how to use them that's okay too. That is an advanced lesson I teach after you have mastered the CCI, Stochastics, Bollinger Bands, and the two Moving Averages.

These days I Day Trade the 2X ETF's for the most part. My favorites are SDS and SSO which are the UltraShort S&P500 ProShares, and the Ultra S&P500 ProShares on the Long side. A 2X ETF moves two points for every point the S&P500 moves, and that is an easier way to make more money in a shorter period of time. The charts of SSO and the S&P500 move in tandem and almost tick for tick since SSO is benchmarked to the $SPX chart. The chart for SDS move two ticks in the opposite direction from the $SPX chart.
As you can see in the chart below, SSO can move up one dollar very quickly. If you had bought 1000 shares at $24.80 you could have sold it fourteen minutes later at $25.80 for a gain of $1000.00 The CCI Buy and Sell Signals on this chart worked perfectly for this trade.
My net income from Day Trading exceeds $100,000. per year if I trade full-time, and I can teach you how to do this too! These days I just trade part-time. I begin my day before the opening bell, and I do two, three, or four trades before lunch time and then call it a day so I can go do something else.

Here is a screen shot from 2006 of a five day period of my Excel spread sheet that I do my daily accounting on after the closing bell rings. This was the year that I finally perfected my strategy, and my gains have improved dramatically since then. I had 13 winning trades for a total of $1786.27 and 5 losing trades of $523.04 for a total of $1263.23 in five sessions, which is a very good weekly income. Especially since I was usually done trading before lunchtime each day. Also notice that my losses were all around $100.00 except for the one that got away from me because it was moving so fast that by the time I sold it, it had cost me another $50.00 or five cents with 1K shares. This screen shot is too wide to fit onto this webpage, so click:
HERE (to view it in a new window)
It's also a good idea to find stocks that mirror the movements of the Exchange it's traded on. That makes it much easier to anticipate the next move of any stock. AKAM is real good about moving in tandem with the Nasdaq Composite's charts most of the time like these charts show. As you can see, this two and a half day time frame shows that AKAM moved nearly tick for tick with the Nasdaq.

These days, one of my favorite stocks to trade is TSO because it mirrors the movements of the Dow Jones Industrial Average's chart. I took a Short position when TSO broke below $10.21 this day, and forty-five minutes later I Covered my Short position one dollar lower and made nearly $1000.00

Day Trading doesn't rely as much on understanding the Fundamentals of a company you are trading like Swing Trading does. But you must keep up with the latest News Releases, and any recent Insider Buying or Selling. You must also know if any analysts that cover your favorite companies have given them an Upgrade or a Downgrade recently, or have changed their EPS estimates for the upcoming quarter or fiscal year. All of thing things can have an impact on the near-term movements of your favorite stocks.
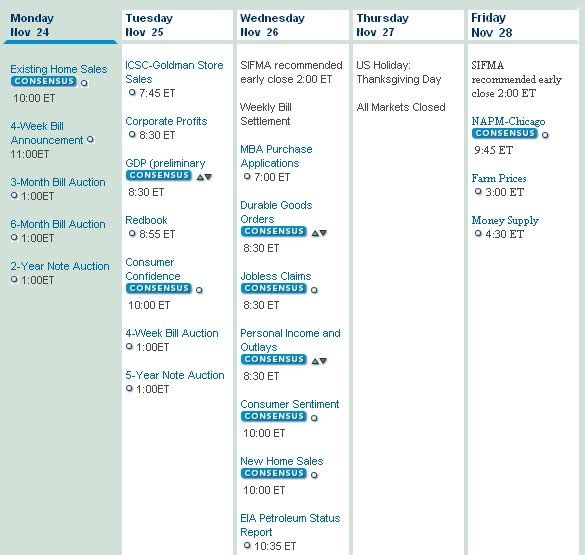
An interesting time to Day Trade is when an Economic Report on the economy is released. This happens many times a week as this Economic Calendar shows: It very important to know what Economic Reports are to be released each day and at what time, especially when you Day Trade stocks that mirror the movements of the Nasdaq and the other indicies. That's because when one of these Economic Reports is released, the Dow, Nasdaq, and S&P500 can move up or down a lot very quickly depending on how The Street views the Report. It's also important to learn which of these reports can have a bigger impact on the overall market when they are released. There is a lesson on this subject in these lessons.
It's essential to always have a program on your TV like CNBC at all times while Day Trading. World events and news from a company that is a Dow component can have a dramatic effect on the movements of the Stock Market during the course of a day. Day Traders look for these kinds of opportunities.
Learning that a Company has just received an Upgrade or Downgrade from the Wall Street Analysts that cover it, is a good reason for entering a Day Trade on that particular Stock. These kinds of trades playing Upgrades or Downgrades usually last all day, and can be played again the next day too.
Reporting Season is another great time of year to Day Trade. It comes four times each year when SEC regulations require that every company reports their earnings for the quarter and/or their fiscal year. When a company beats (or misses) the analyst's expectations for earnings per share and revenue, the stock can have some interesting and sometimes extremely volatile moves in a very short period of time. Most companies do not report earnings while the market is open, so you must have charting software that will show the charts moving in real-time during the pre-market and after-hours sessions. I do not recommend that novice traders attempt to trade Earnings Reports in the extended-hours sessions. But if you are an experienced trader, I can show you how to play these Earnings Reports.
As a rule, Day Trader's almost never hold a position overnight. Here is why I only Day Trade these days. Look at how the Dow dropped about 450 points in the last hours of this day's session. If you weren't watching the market all day, you would have been right back where it started at the low of the day at lunchtime. I like to ride it up going Long, and then go Short when the double-top chart pattern says to:

Day Trading is my favorite style of trading. When I Day Trade, I have four charts up for the particular Stock I am trading in four different time frames, and a one minute chart for the Exchange it trades on.
It is necessary to have more than one monitor hooked up to your computer. I have four monitors on mine. I combine elements from the Scottrader and the Fidelity Active Trader Pro trading platforms. The Fidelity charts are the best I've ever found, but the Watch List and Time and Sales windows aren't as good as the one's Scottrader has. Here is what my four monitor trading setup looks like. Be sure to click on the image to enlarge it to full size, and scroll far to the right to see the whole thing:
CLICK HERE:
If you don't have multiple monitors on your computer, here is the piece of hardware I have hooked up to mine that allows you to easily add two or three more monitors:
CLICK HERE:
I will show you how to Day Trade any stock of your choice (if it meets certain criteria) successfully using only three charts, a Level 2 window, and a Time and Sales window. And on these three charts you will only need to have four Technical Indicators that are the cornerstone of my strategy.
Here are links to my website. Be sure to visit the Video Charts page to view three sample videos that show actual Day Trades that I have done in real-time while the market is open. There are many videos below them that are all about Swing Trading, and you can learn a lot just by watching them.
HOME
VIDEO CHARTS
Here is a video of a couple of trades I did on SSO last year. This is just one of the 28 videos that you get when you order the series of lessons I offer on Day Trading. That's 18 hours of videos to study, and I'll be adding many more to the lessons this year.


