Learn how to Day Trade the Stock Market from a professional trader with over fifteen years of experience. My specialty is offering one-on-one tutoring to each of my students, and my favorite teaching tool is making videos of my trades so that you can see exactly how it's done. I've been teaching Day Trading for six years, and many of my students have become very successful traders. The Day Trading strategy I've perfected is very simple, and very easy to learn.
ANX submitted a NDA (new drug application) to the FDA during the last week of December 2009, and the FDA has sixty days to give the company it's decision if it will accept the application or issue a RTF Letter (refusal to file letter). That means that the company most likely has already received the FDA's decision, and they have 72 hours after receiving the decision to issue a Press Release about the decision. There should be a PR about this released during the week of March 1st to March 5th 2010.
There has been a lot of talk this weekend if the FDA accepts the NDA for ANX-530 will it be eligible for either Fast Track or Priority Status, which would reduce the number of months until it's PDUFA date. A normal time frame for a PDUFD date to be set is ten months from the date the NDA was submitted. Since the NDA was submitted during the last week of December 2009, the Normal Review PDUFA date would be set for the last week of October 2010. Receiving an accelerated review with either a Fast Track or Priority Review Status would reduce the PDUFA date by a number of months depending on which accelerated status it receives.
In order for a NDA to be classified with an accelerated status the company must request it when they submit the NDA. We have no idea if ANX requested a Fast Track or a Priority Review when they submitted the NDA application.
There are a lot of traders on the many message boards I am a member of, and blogs that I read that think the share price of ANX will skyrocket up once we get the PR that the FDA has accepted the NDA for ANX-530. In all of the years I've been following FDA plays, I've rarely seen a huge move up on just the news that a NDA was accepted.
There may be a nice move up on the day the FDA news is PR'd due to retail buying and maybe a little bit of Short Covering. But as soon as buying volume drys up I have a feeling the Shorts will be adding to their positions again in an attempt to hold this stock down like they've been able to do most of this year.
The only times I've seen a large and sustainable increase in the share price is if the FDA assigns either Fast Track or Priority Status. When that happens, the market really takes notice and the share price soon reflects it.
If the FDA accepts the application that would be very good news for this company because the FDA is not only ruling if the drug ANX-530 is worthy of further review, but more importantly that their proprietary emulsion process also has merit. Every new drug this company has in it's pipeline and plans to submit to the FDA for approval is based on this unique and patentable emulsion technology.
During the past two months, there has been a lot of talk about a buyout, takeover, or partnership of ANX by either GlaxoSmithKline (NYSE-GSK) or Sanofi-Aventis (NYSE-SNY). The reason one or both of these huge drug manufacturing companies would be interested in in taking ANX over is because they both stand to lose a lot of potential market share if ANX's drugs go to market in competition with their existing drugs.
ANX-530 would be in direct competition with GSK's drug Vinorelbine, which has a worldwide annual market estimated at around $200 million. ANX-514 would be in direct competition with SNY's drug Taxotere, which has a worldwide annual market share estimated at around $3 BILLION! Not only would they be removing competition from their existing drugs, but they would also become owners of the proprietary emulsion technology that could be applied to many other existing drugs to make them safer and more effective.
Usually, when a buyout offer is tendered, the offer price is between 300-500% above the current share price. ANX is currently trading at around $0.30 per share so a 300% increase would put the buyout offer at $0.90 and a 500% increase would put the buyout offer at $1.50 The traders that are calling for a buyout offer between $3.00 to $4.00 are dreaming in my opinion.
There are many traders that entered Long positions hoping for buyout to happen, because they have done their research on this company and know it is a definite possibility. If they hold a sizeable position between $0.15 to $0.50 they stand to make a nice profit if a buyout offer is tendered.
I am one of those traders, but I didn't enter my position just because of the possibility of a buyout. I have looked into this company's history, and there has been a lot of good changes made since the previous CEO ran the company. But the bottom line is I think that their technology is fantastic, and it will be able to make many existing drugs much more effective and safer.
Here is a three month/daily chart of ANX. It ran from below $0.10 to $0.52 in the past few months, and it has held half of it's gains which shows a lot of strength and is considered Bullish. Keep this stock on your radar next week, because if the PR comes out saying that the NDA for ANX-530 has been accepted there should be a nice move to the upside. If the FDA assigns an accelerated review process designation, there may be a very large and sustainable move of the share price to the upside. In My Honest Opinion.
NuVasive Reports Fourth Quarter and Full Year 2009 Financial Results:
- Full year 2009 total revenue of $370.3 million; up 48.1% from the full year 2008
- Fourth quarter total revenue of $106.9 million; up 43.4% from fourth quarter 2008 and up 12.7% from third quarter 2009
- GAAP earnings of $2.3 million, or $0.06 per share, for the fourth quarter and $5.8 million, or $0.15 per share, for the full year
- Earnings, excluding certain adjustments, of $4.2 million, or $0.11 per share, for the fourth quarter and $12.3 million, or $0.32 per share, for the full year
- Operating cash flow of $46.4 million for the full year; up from ($5.0) million for the full year 2008
NUVA had 10X it's average daily volume on Friday, and the biggest volume day in the three months this chart shows after they released end of the year and end of the quarter financial results. It's obvious that the market really liked their report. This stock may continue up on Monday, it may run sideways for a while, or it could pull back drastically. There may be some good scalping opportunities on this stock next week.
YRCW [NASD] - YRC Worldwide Inc. - Services - Trucking
YRCW got over five times it's average daily volume on Friday, and had the biggest volume day on this three month chart. All of the technical indicators are upticking sharply, and it appears to me that this one has bottomed. This might be a good time to enter a Swing Trade on this stock, and may also be a good one for Day Trading.
RJET had over four times it's average daily volume on Friday, and also had it's biggest volume day in the past three months. It has broken above the resistance level at $5.50 and now has little resistance all the way up to the $7.00 area, and all of the technical indicators are upticking. This may be a good time to enter a Swing Trade position on this stock, and there may be some good Day Trading to be done on this one too...
This is the third weekend I've done the end of the week Fundamental and Technical Analysis of ANX's daily and weekly charts...
We are expecting news in the very near future that will tell us if the FDA has accepted the NDA (new drug application) for their drug candidate ANX-530
Things are about to get VERY interesting with this stock in the next week or two...Stay tuned for recent developments as they happen...
Disclaimer: I hold a lot of shares of ANX, and am VERY Bullish on this company...GLTA
Day Traders use every tool at their disposal to help them decide when a good time to enter or exit a trade will be.
Time & Sales and Level 2 are two such tools. This video is a brief explanation of how these tools are used to determine if a stock or Exchange Traded Fund (ETF) will go up or down in the next few seconds.
These tools can not be used for Swing Trading or for day trades that last for hours when the market is trending strongly either up or down.
These tools do help when you are doing Scalping types of day trades. Scalping is when you enter a trade that will only last for a few minutes with a large block of shares. When the stock or ETF has moved up or down ten to fifty cents very quickly, that is a good time to exit the position to lock in your profits before the trend reverses.
When I do Scalping trades, I usually buy 1000 to 5000 shares. With 1000 shares, I'm looking for a move in the ten to thirty cent range in five to fifteen minutes. A ten cent move yields $100. and a thirty cent move yields $300.
When I trade 5000 shares, I'm looking for the stock to move five to twenty cents in five to fifteen minutes. A five cent move yields $250. and a twenty cent move yields $1000.
Sometimes I trade using 10,000 shares. Each penny the stock moves in the direction I want it to is worth $100. So if a stock moves ten cents, that yields $1000. usually in less than fifteen minutes.
These tools work better on some stocks or ETF than others. It is hard to use these tools on a stock or an ETF that trades 100 million shares each day. They work best on stocks that trade 5 to 25 million shares per day. The less daily volume a stock gets, the easier it is to see how these tools work.
While I can show you the basics of how these tools work, the only way you will get proficient at reading them is to study them for many hours each day over a period of a few years. If you would like to read more about Time & Sales and Level 2, here is a good article on the subject:
If you watch the three videos at the top of the Video Charts page of my website that show me doing real-time day trades while the market is open, you'll see that I mention these two tools and show how they work in action.
We only have to wait two weeks or less before we hear if the NDA for ANX-530 will be accepted by the FDA...That news WILL determine the next move for this stock...Either up or down...Volume should pick up again once this news is released...
This video is viewed best at 480p and full-screen mode...Start the video, click on 480p in the lower right corner, then click the four arrows pointing different direction to go to full-screen mode...Press the Escape key on your keyboard to exit full-screen mode...
Here is a ten minute video that briefly explains everything you can learn by taking my Day Trading Lessons.
Some of the subjects I mention in this video are about Swing Trading, but they also apply to Day Trading somewhat. Day Trading is all about entering a trade in reaction to either good or bad news of some kind that has the ability to move a particular stock or the overall market either up or down. These kind of trades can last from fifteen minutes to a few hours. As a general rule, day traders never hold a position overnight, but there are rare exceptions to this rule.
If this news is about a particular company, I trade the stock in that company either Long or Short if the news is good or bad. If the news is about the overall economy, I will trade SSO if the news is good, and SDS if the news is bad. SSO is the 2X Bull ETF that is benchmarked to the intraday chart of the S&P 500. For every tick up of the S&P 500 chart, SSO moves up two ticks. SDS is the inverse, or Bear 2X ETF benchmarked to the S&p 500's intraday chart. For every tick down of the S&p 500's chart, SDS ticks up two ticks.
Swing Trading requires that you keep up with a lot more things that can affect the movement of the share price of a company's stock. SSO and SDS are not good ETF's to Swing Trade, and should only be used for Day Trading. I specialize in Day Trading, but I also have another account for Swing Trading good companies, and I sometimes hold a position in a stock for a few weeks or even a few months. And in that account I also hold a few stocks that pay a good dividend, and those I have owned for years.
Happy Trading,
zigzagman
(this video is viewed best in full-screen mode using the 480p setting)
In order to Day Trade successfully, you must first find a stock that is a good candidate. My criteria is a stock that is over $10.00 per share and has an average daily volume of around 5 million shares traded per day. This ensures that there is adequate market liquidity so that when you want to sell your shares with a Market Order, it will all fill without moving the PPS up or down on the chart as it fills.
My criteria for a good stock for Day Trading doesn't have to be yours. If you can't afford to trade the expensive stocks, there are still many other good stocks that are inexpensive to trade. The trick is knowing how to find them.
The Scanner at StockCharts.com
Here is a great place to scan for stocks in every price range that are showing very positive or very negative characteristics, which will give you good Long and Short Sell candidates. My favorite categories to scan are: Strong Volume Gainers, Bullish MACD Crossovers, Bearish MACD Crossovers, Overbought with a Declining RSI, Oversold with an Improving RSI, Moved Above Upper Bollinger Band, Moved Below Lower Bollinger Band, New CCI Buy Signals, and New CCI Sell Signals. All of the charts in these scans are daily charts, but they are still very helpful in finding good trading candidates to go Long or Short on. You are primarily looking for stocks that are breaking above levels of resistance to go Long on, or have broken below major levels of support to go Short on.
First, look for a price range you are comfortable with, and then look in the Volume column to make sure it has at least a few million shares traded daily on average. This scan page gives you the choice to pick stocks on the: Nasdaq, NYSE, AMEX, TSE, and CDNX Exchanges. Once you have selected a stock to look at, you will want to click on the square button to the left of the ticker symbol that has a red vertical bar surrounded by two blue ones. This will open a Sharp Chart for your selection, and you can edit many of the settings on these charts to suit your personal preference.
The Finviz.com Scanner:
This is the best scanner I've ever come across. The number of filters you can apply is simply amazing. I highly recommend this scanner:
Another way I've always found interesting stocks to play is by finding which ones have a lot of interest by other Day Traders. This is done by seeing which stocks are being talked about the most on stock market message boards. There are too many of them to mention here, and I am a member of six or seven of them. My all time favorite message board is Investors Hub (IHUB), and you can browse many of the Free Boards as a free member. You don't need to pay to join this site, but I do because it gets rid of all of the ads that are shown only to free members, and there are a lot of additional functions available only to paid members:
I follow many different boards there, and they cater to stocks of all shapes and sizes. Most of the boards there are for Penny Stocks which I avoid at all costs, but there are also a lot of boards dedicated to Big Board Stocks only. Look around, and do a Search for your favorite stocks in the search box at the top of each page and you'll probably find a board that suits your tastes. Here is a list of all of the boards on IHUB:
If you are into playing penny stocks because they are your favorite kind of stock, or that's all you can afford to play, here are a few boards that talk mostly about those kinds of stocks. They talk about stocks that are moving NOW, and have plenty of MOMO (movement), and have unusually high Volume. These boards are moderated by the very best traders IHUB has, and they have been posting on this site as long as I have if not longer. A few of these members were my teachers/mentors many years ago, and I have to say that I would not be where I am now if I hadn't learned so much from these people about how to read charts with Technical Indicators on them.
There are hundreds of good boards on the IHUB site. I highly recommend it, and it's up to you if you want to check it out. I spend a lot of time on that site while the market is open, and before and after market hours. Over the years, I have made numerous friends there and it will always be a place I will call home.
A WORD OF WARNING!:
Stay away from any stock that is listed on the Pink Sheets Exchange. They are on the Pink Sheets for reason. Most of them are nothing more than outright SCAMS! In my 15+ years of trading, it has been my observation that 99% of Pink Sheet companies are on that exchange for a reason. If they were a "real" company, they would be listed on a larger exchange where they would be required to submit SEC Filings on a regular basis. If the Transfer Agent for the stock is gagged, that's a huge red flag in my opinion.
And also beware of most stocks listed on the Over The Counter Bulletin Board exchange. They aren't much better, since they are not required by the SEC to submit Quarterly and Yearly Reports. Both Pinks (Stinky Pinkies) and OTC-BB companies are commonly known for massive share dilution, corruption, and deceit.
If you are going to trade the Stock Market, at least do it with respectable companies. The other drawback to trading Pinks and BB stocks is that you are required to use Limit Orders to Buy or Sell shares. A true Day Trader ALWAYS uses Market Orders to get nearly instant execution at either the Bid or the Ask depending on if he is Selling or Buying.
Other Good Stock Market Message Boards:
Here are just a few of the message boards I have enjoyed over the years. There are many more than this, so if this is your kind of thing, do a Google Search and see what other ones you can come up with. But beware...some of them are outright nonsense since they are totally unmoderated. Personal attacks are common, and so are a lot of other annoying things. That's why I like IHUB so much. They have a good set of rules and they enforce them. These have been some of my favorites over the years. Whatever you do, stay away from Raging Bull. It has to be the worst example of a message board I've ever come across.
And Finviz.com used to have an awesome forum, but it has been discontinued. It's still a great place to do research on stocks: http://www.finviz.com
StockTwits is connected to Twitter:
Unlike all of the message boards listed above, StockTwits posts everyone's tweets in real-time just seconds after it is posted. So what you are seeing on this site is what everyone is trading all on one page. There are hundreds of stocks being discussed every hour, and people post their buys and sells in real-time. It is an extremely fast paced type of message system, and is not for everyone. I usually stick to one or two stocks to trade per week, but it is interesting to see what the most heavily traded stocks are on StockTwits if you are looking for ideas on what to trade:
The first is called Scalping, which entails entering very short term trades with a large amount of shares, hoping for a relatively small movement in the price. Most Scalping trades usually last no more than five or ten minutes, and can give you a few hundred dollars or more in net profits. These kinds of trades are usually done primarily using the one-minute chart, with help from the five-minute chart.
The other style of Day Trading can last much longer. This kind of Day Trade can last as long as an hour, or even a few hours if it goes very well. I will teach you when it's time to stay in a trade to maximize profits if the trade is going well. These kind of trades primarily use the five-minute chart, but I also use the fifteen-minute and the hourly charts too.
Day Trading is a very exciting and fast paced way to trade the Stock Market. It is also the fastest way to learn all about Charts and Technical Indicators in the shortest amount of time. Due to the extreme volatility we've seen in the market in 2008 - 2009, Day Trading is the safest and most profitable way to trade these days.
Day Trading requires a solid understanding of reading Candlestick Charts and just a few of the Technical Indicators that are included with them. The Technical Indicators will give you very clear Buy and Sell Signals many times a trading session. You must also know how to read Time & Sales and Level 2 windows. That is exactly what you will learn when you take these lessons.
Here is an example of a one and a half day chart of Akamai Technologies (AKAM),
which was my favorite stock to Day Trade in 2005-2006.
As you can see, it moves a dollar or more very quickly, and I'll teach you how to play these swings up and down so that you can profit either way it moves. On the chart below, you are not only limited to buying at the bottom and selling at the top. Once you sell at the top, you can immediately take a Short position and ride it to the bottom. Then you will Cover your Short position and immediately take a Long position and ride it back up to the top.
There are just a few Technical Indicators necessary for my Day Trading strategy to work. The Commodity Channel Index (CCI) gives very clear and accurate Buy and Sell Signals, and I use Stochastics (STO) to confirm them. Bollinger Bands are also very important in my strategy, and Volume is too. The last two Indicators I use are the 5 Simple Moving Average (5-SMA) and the 15 Simple Moving Average (15-SMA) which also give good Buy or Sell Signals.
The chart of TSO below shows how I setup my charts for Day Trading. I also use three extra Technical Indicators known as the Money Indicators. They basically show if there are more Buyers or Sellers. The dark green one at the top is Chaikin Money Flow (CMF), the yellow line is On Balance Volume (OBV), and the light blue one is the Accumulation/Distribution (A/D) line.
In order for my strategy to work, you don't really need to learn these three additional Technical Indicators. It works fine without them, but if you want to learn how to use them that's okay too. That is an advanced lesson I teach after you have mastered the CCI, Stochastics, Bollinger Bands, and the two Moving Averages.
These days I Day Trade the 2X ETF's for the most part. My favorites are SDS and SSO which are the UltraShort S&P500 ProShares, and the Ultra S&P500 ProShares on the Long side. A 2X ETF moves two points for every point the S&P500 moves, and that is an easier way to make more money in a shorter period of time. The charts of SSO and the S&P500 move in tandem and almost tick for tick since SSO is benchmarked to the $SPX chart. The chart for SDS move two ticks in the opposite direction from the $SPX chart.
As you can see in the chart below, SSO can move up one dollar very quickly. If you had bought 1000 shares at $24.80 you could have sold it fourteen minutes later at $25.80 for a gain of $1000.00 The CCI Buy and Sell Signals on this chart worked perfectly for this trade.
My net income from Day Trading exceeds $100,000. per year if I trade full-time, and I can teach you how to do this too! These days I just trade part-time. I begin my day before the opening bell, and I do two, three, or four trades before lunch time and then call it a day so I can go do something else.
Here is a screen shot from 2006 of a five day period of my Excel spread sheet that I do my daily accounting on after the closing bell rings. This was the year that I finally perfected my strategy, and my gains have improved dramatically since then. I had 13 winning trades for a total of $1786.27 and 5 losing trades of $523.04 for a total of $1263.23 in five sessions, which is a very good weekly income. Especially since I was usually done trading before lunchtime each day. Also notice that my losses were all around $100.00 except for the one that got away from me because it was moving so fast that by the time I sold it, it had cost me another $50.00 or five cents with 1K shares. This screen shot is too wide to fit onto this webpage, so click:
It's also a good idea to find stocks that mirror the movements of the Exchange it's traded on. That makes it much easier to anticipate the next move of any stock. AKAM is real good about moving in tandem with the Nasdaq Composite's charts most of the time like these charts show. As you can see, this two and a half day time frame shows that AKAM moved nearly tick for tick with the Nasdaq.
These days, one of my favorite stocks to trade is TSO because it mirrors the movements of the Dow Jones Industrial Average's chart. I took a Short position when TSO broke below $10.21 this day, and forty-five minutes later I Covered my Short position one dollar lower and made nearly $1000.00
Day Trading doesn't rely as much on understanding the Fundamentals of a company you are trading like Swing Trading does. But you must keep up with the latest News Releases, and any recent Insider Buying or Selling. You must also know if any analysts that cover your favorite companies have given them an Upgrade or a Downgrade recently, or have changed their EPS estimates for the upcoming quarter or fiscal year. All of thing things can have an impact on the near-term movements of your favorite stocks.
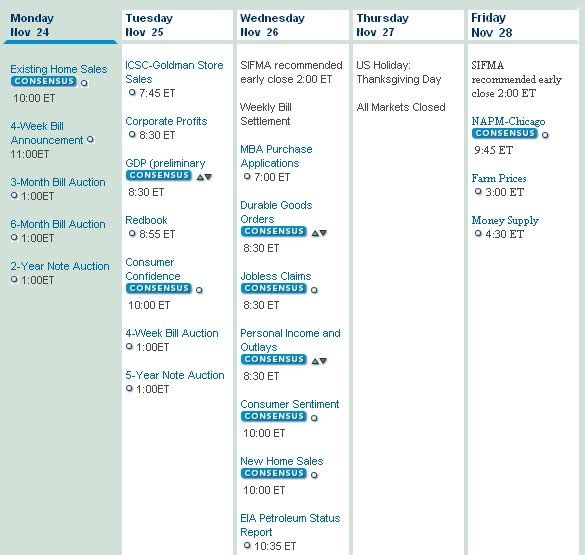
An interesting time to Day Trade is when an Economic Report on the economy is released. This happens many times a week as this Economic Calendar shows: It very important to know what Economic Reports are to be released each day and at what time, especially when you Day Trade stocks that mirror the movements of the Nasdaq and the other indicies. That's because when one of these Economic Reports is released, the Dow, Nasdaq, and S&P500 can move up or down a lot very quickly depending on how The Street views the Report. It's also important to learn which of these reports can have a bigger impact on the overall market when they are released. There is a lesson on this subject in these lessons.
It's essential to always have a program on your TV like CNBC at all times while Day Trading. World events and news from a company that is a Dow component can have a dramatic effect on the movements of the Stock Market during the course of a day. Day Traders look for these kinds of opportunities.
Learning that a Company has just received an Upgrade or Downgrade from the Wall Street Analysts that cover it, is a good reason for entering a Day Trade on that particular Stock. These kinds of trades playing Upgrades or Downgrades usually last all day, and can be played again the next day too.
Reporting Season is another great time of year to Day Trade. It comes four times each year when SEC regulations require that every company reports their earnings for the quarter and/or their fiscal year. When a company beats (or misses) the analyst's expectations for earnings per share and revenue, the stock can have some interesting and sometimes extremely volatile moves in a very short period of time. Most companies do not report earnings while the market is open, so you must have charting software that will show the charts moving in real-time during the pre-market and after-hours sessions. I do not recommend that novice traders attempt to trade Earnings Reports in the extended-hours sessions. But if you are an experienced trader, I can show you how to play these Earnings Reports.
As a rule, Day Trader's almost never hold a position overnight. Here is why I only Day Trade these days. Look at how the Dow dropped about 450 points in the last hours of this day's session. If you weren't watching the market all day, you would have been right back where it started at the low of the day at lunchtime. I like to ride it up going Long, and then go Short when the double-top chart pattern says to:
Day Trading is my favorite style of trading. When I Day Trade, I have four charts up for the particular Stock I am trading in four different time frames, and a one minute chart for the Exchange it trades on.
It is necessary to have more than one monitor hooked up to your computer. I have four monitors on mine. I combine elements from the Scottrader and the Fidelity Active Trader Pro trading platforms. The Fidelity charts are the best I've ever found, but the Watch List and Time and Sales windows aren't as good as the one's Scottrader has. Here is what my four monitor trading setup looks like. Be sure to click on the image to enlarge it to full size, and scroll far to the right to see the whole thing:
If you don't have multiple monitors on your computer, here is the piece of hardware I have hooked up to mine that allows you to easily add two or three more monitors:
I will show you how to Day Trade any stock of your choice (if it meets certain criteria) successfully using only three charts, a Level 2 window, and a Time and Sales window. And on these three charts you will only need to have four Technical Indicators that are the cornerstone of my strategy.
Here are links to my website. Be sure to visit the Video Charts page to view three sample videos that show actual Day Trades that I have done in real-time while the market is open. There are many videos below them that are all about Swing Trading, and you can learn a lot just by watching them.
Here is a video of a couple of trades I did on SSO last year. This is just one of the 28 videos that you get when you order the series of lessons I offer on Day Trading. That's 18 hours of videos to study, and I'll be adding many more to the lessons this year.
Here is an analysis of ANX's daily chart. It was created yesterday around lunch time, and this was the first day of trading after ANX's CEO Brian Culley gave his presentation at the Bio CEO & Investors Conference.
ANX closed down two cents yesterday. I won't draw any conclusions about that yet, because it will take a few days before potential large and institutional investors decide if they will invest in this company or not.
One reason for the drop in share price yesterday is probably because the day traders bailed out when no new and earth moving news was released at the conference. Many people probably took positions in this stock hoping that there would be a big pop up in the share price right after the presentation. When that didn't happen, they moved on to greener pastures.
It's starting to look like the share price may not move much for the next two to three weeks as we await news from the FDA if the new drug application for ANX-530 will be accepted or not.
Here is an interesting reply to a post I made on the Yahoo Finance message board for ANX, that clarifies a few things very well. This member has my respect, since he works in the field of biotechnology research and knows quite a bit about the process of bringing new drugs to market through FDA aprroval:
"Gentlemen, I appreciate the attempt at substantive conversation about ANX and its product candidates. I will not comment on the potential stock price both prior to and after the ACCEPTANCE (not approval) of the NDA filing. What I would like to do is clear up some misunderstandings expressed in these two posts.
First, what we are awaiting in March is the acceptance of the filing. This is a confirmation that the NDA was properly FORMATTED and prepared according to protocol. This does not reflect in any way on the merits of the application (ie:chances for approval). If there are filing inadequacies, they will be noted and subsequently corrected by the company. That is the only delay possible. The agency will not/cannot request additional trials, as this would amount to a judgement on the merits of the application which will not be done until 10 months from the filing date.
To be clear: there is NO POSSIBILITY for priority review or fast rack status. This drug does not represent the treatment of unmet medical need as per FDA guidelines. Please don't debate this just look it up if you have questions. 10 months will be the review time.
Next. You made some reference to news re: 514 about an NDA filing. The guidance on this program was given yesterday, and quite clearly to those that listened to the presentation.
Anx must prepare a package laying out its arguments as to why the increase in the plasma concentration of docetaxol during the first 3 hours of administration of 514 is not relevant to prevent a finding of bioequivilence. After the filing of this package, the FDA has 60 days to set up a meeting. AFTER this meeting, the company will announce future plans for 514. Hence no surprise announcements, until May at the earliest.
And again, just for terminology and expectations, the FDA will not "approve" 530 in two weeks. The will hopefully accept the filing of the application for approval in October.
I know there are well meaning longs on this board, but it really would help to have all of the facts and not create expectations on erroneous premises.
As I have said many times here, I am long a large number of shares and am looking forward to the setting of the PDUFA date for October for 530. But I don't personally see the properly formatted application being a huge share price event. I frankly expect it as anyone who is long this stock should. It will not be a surprise.
514 in May is the news that blows the lid off of this stock. Is 3 months really that long to wait for an "investor?"
After watching ANX's presentation a couple of times yesterday, these are my impressions.
First, CEO Culley said that they should hear from the FDA about their decision to accept or deny the NDA for ANX-530 "in the next two weeks or so". This is something we all knew already, because the NDA was submitted in the final days of December 2009. The FDA has 60 days to make it's decision to accept, ask for more data (which means a long delay), or outright reject the NDA.
That gives the FDA until the last week of February or the first week of March to give ANX their decision on the NDA. I've been following small cap and micro cap biotech companies for about two years, and in all that time I've never seen the FDA render a decision early. So the best we can hope for is for the company to get their decision around the first of March, and to release a Press Release soon thereafter.
Yesterday's presentation was nearly a carbon copy of the presentation they made at the OneMedForum conference in San Francisco on December 15th 2009. The slide show was exactly the same, and the CEO's speech was almost identical. There were no new developments mentioned that we weren't already aware of. It was a very good presentation though, and I really like Mr. Culley's enthusiasm and speaking style.
The purpose of these types of conferences is to inform investors of what the company is all about, and to hopefully get them to invest in the company. I hope that Mr. Culley was successful in doing just that.
If you would like to listen to the presentation, here is a link to go to the webcast:
ANX is one of my favorite small cap BioTech stocks at the moment.
It is listed on the AMEX exchange, and is currently trading at around $0.30 per share. It has been a Volume Leader on the AMEX for two months or so. Here is a link to the company's website:
ADVENTRX Pharmaceuticals is a biopharmaceutical company focused on in-licensing, developing and commercializing proprietary product candidates primarily for the treatment of cancer. The Company seeks to improve the performance and commercial potential of existing treatments by addressing problems associated with these treatment regimens.
ADVENTRX is presenting at the 12th Annual Biotechnology Industry Organization CEO & Investor Conference. Here is a list of all of the companies presenting at the conference. I have been following many of them for over a year:
I don't expect any new news to be presented at this conference, because SEC Regulations require that a press release of any material event must be published to the entire world and not just to the participants of a conference.
But they may surprise us on this, because some types of developments don't require a press release. The best news they could give us today would be to name a target date for submitting a new drug application (NDA) for the second drug in their pipeline ANX-514.
There have also been buy out rumors spread all over the internet about this company over the past two months, but I don't think this has a possibility of happening until after the FDA approves the NDA for their first drug candidate ANX-530. ANX submitted a NDA to the FDA for this drug the last week of December 2009, and the FDA has sixty days to rule if they will accept or decline this NDA or not. We should hear news on this during the last week of February, or during the first week of March.
There are also talks of partnerships with one or more of the big BioTech companies. One of the purposes of a conference like today's is to have private meetings with the CEO's of the presenting companies. News of either a buy out or a partnership would surely be good news for this company, and it should reflect well on their share price.
I will be watching for unusual volume and price action on ANX today and the rest of this week. I will post my thoughts about their presentation later today. ANX is one of the few stocks that I am an "investor" in. I also have another block of shares that I trade in and out with using my day trading account.
As you can see, Day Trading is a very profitable way to trade the market in a very short period of time. I usually do two or three trades before lunchtime, and call it a day. A few hundred dollars a day is more than enough for my family to get by on comfortably. A full-time experienced Day Trader can easily gross $100,000. per year or more.
But don't think you can do this without proper training, because you can lose as much money on each trade shown above in a very short amount of time. Like anything worthwhile in life, you must get educated and pay your dues before you become truly successful.
I can show you how to make this kind of money in a much shorter amount of time than it took me to learn how to do it. You get my fifteen years of experience to show you the best way to Day Trade, without having to make the same mistakes I made when I first began trading.